Debugging Tips
Replay can help you gather more information about a flaky test. There are many strategies that can help you narrow down the root cause of a test failure or flake. Replay DevTools enable you to deep-dive into your code and print out values that would otherwise be hidden from you.
Check out this replay for a detailed walkthrough on debugging a flaky Cypress test. You'll see the capabilities of Replay DevTools and walk through the debugging process of identifying the root cause.
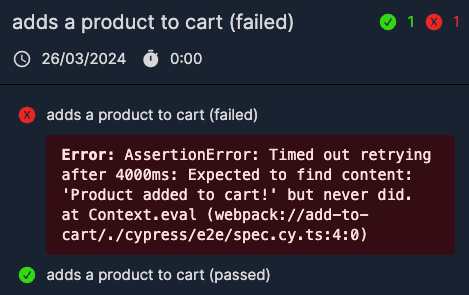
Comparing passed and failed test
Great way to narrow down the root cause of a flaky test is to open two replays - one with a passed test and one with the failed one. Usually the recording can give you enough information to notice the moment when these two tests start to diverge.
A test failure usually ends in "element not found" or other similar message, but this is usually not enough. End-to-end tests carry a lot more context which can be gathered by looking at what the test was doing before it failed.

Adding console logs in the spec file
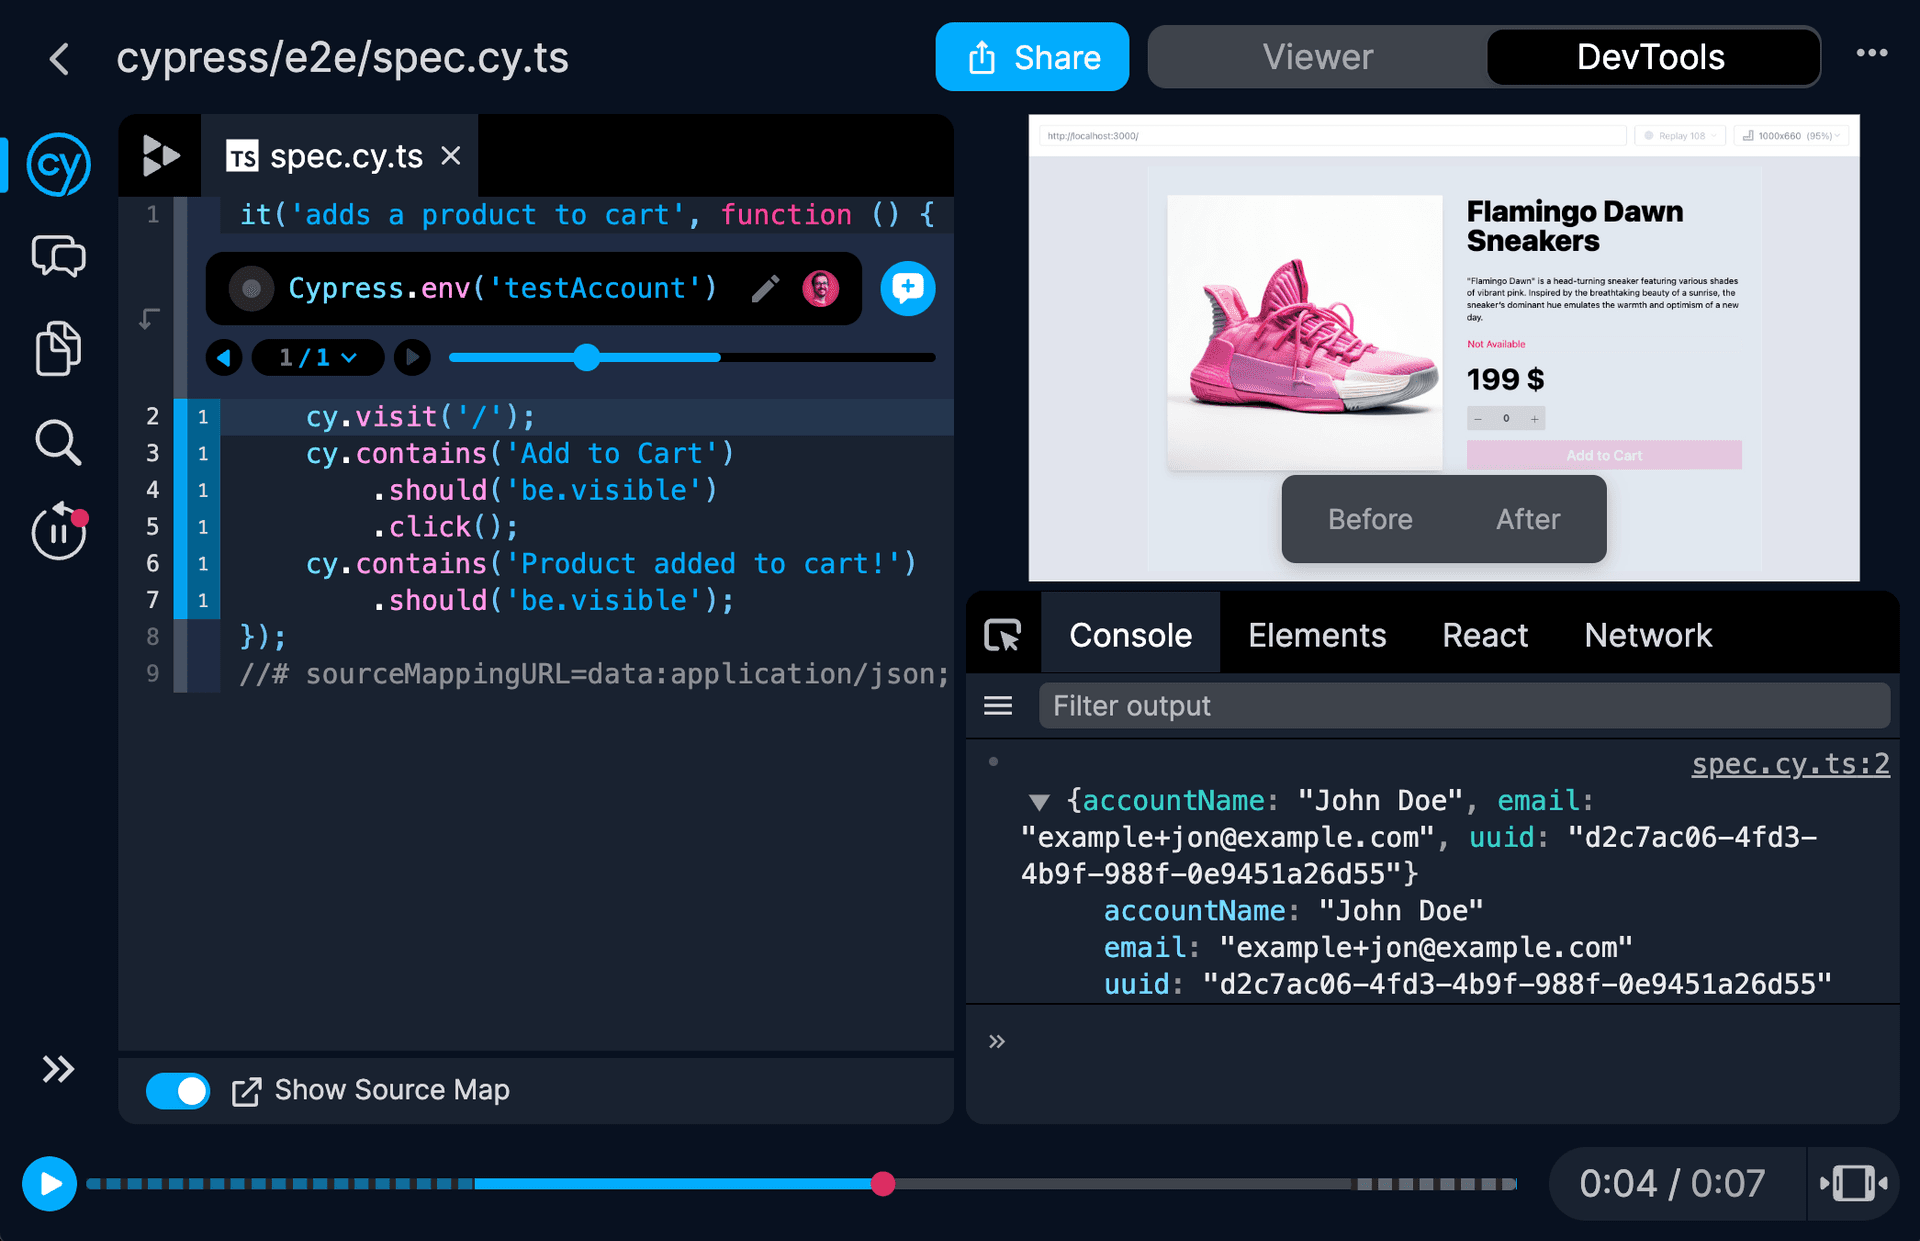
Cypress runs its commands by first creating a queue and then executing these queued commands. This is why adding a console log to spec file is little bit trickier. You can still pull out useful information from within cy.then(), cy.should() or other commands that use a callback.
Console logs can also be useful when debugging test data. Common use case in e2e testing is to create an example user and save it into Cypress.env() object. You can inspect this in your replay.

Jump to application events
With Replay you can jump from a test cy.click() command into the application code. In the example below, you can see the addToCart function highlighted. This function is called when "Add to Cart" button is clicked in the Cypress test.
Great articles on test flakiness
- 8 Common mistakes in Cypress by Filip Hric
- Identifying code smells in Cypress by Josh Justice
- Ways of fixing flaky tests by Kailash Pathak
- 3 Practices to Reduce Flakiness by Jori Gelbaugh
- Getting Rid Of A Living Nightmare In Testing by Ramona Schwering
- Methods for identifying and dealing with flaky tests by Jason Palmer